Monday 6th December, 2010
 by Jason Cale
Building Caffeine Monitor
Wednesday 11th November saw the second instalment of Build Conference come forth in bloom. I attended this hand-made web design conference set in stormy Belfast, as I recalled on my own website.
Whilst I was there soaking in collective wisdom, friends old & new, we also had an offering of our own to launch that fine day.
Caffeine Monitor was an application built to track and display a realtime visualisation of caffeine consumption during the conference.
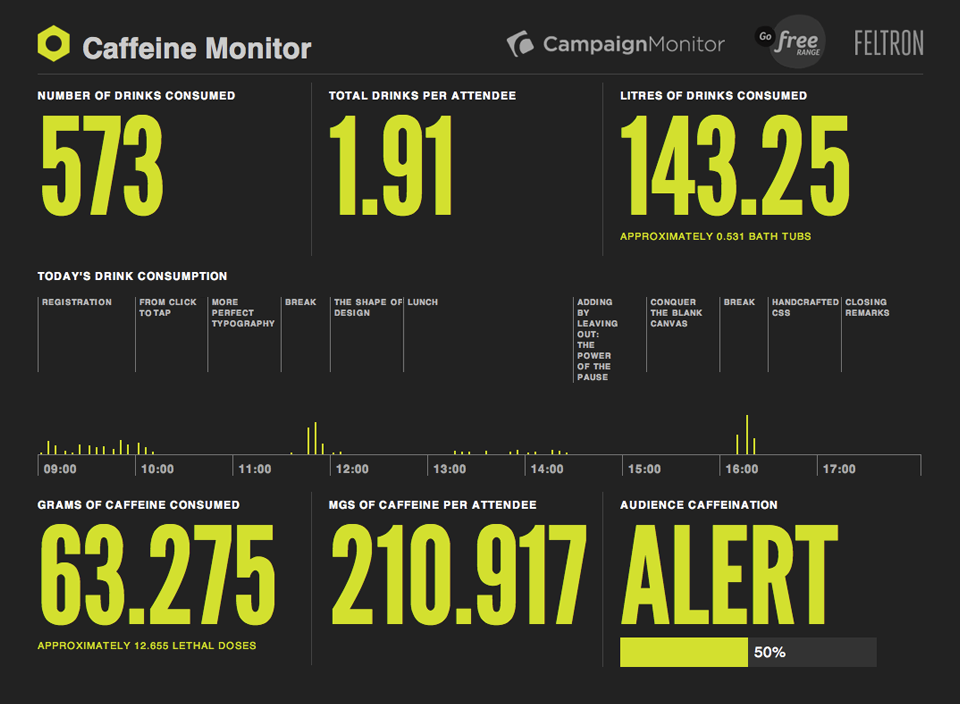
Sponsored by Campaign Monitor, we collaborated with Nicholas Felton who designed an infographic for the application (shown above).
Andy McMillan the man whose Herculean efforts make Build possible, conceived the idea and approached us to help make it a reality.
Application biology
The application consists of two main parts:
- A secured form to capture drinks consumed.
- HTML/CSS based infographic to display the captured data.
To do this we implemented or made use of the following:
- Simple Rails application hosted on the Heroku platform.
- HTML5 offline support using Rack-offline for manifest generation.
- HTML5 local storage to record drinks when offline.
- Javascript to sync with server using JSON.
- iPhone / iPad optimisations for data collection views.
- CSS3 Media queries to target multiple display resolutions.
Collecting data
The way we collected data had to be really really simple. Andy had lined up some volunteers to help out on the day, whom would record drinks picked up from the refreshment stands or in the market at lunch.
They would likely be using iPhones or iPod touches to collect the data, so we made the following assessments about the user interface:
- It should be really simple.
- It should to be really responsive.
- It should collect data with or without internet connection.
- It should recover from losing focus (such as getting a call).
- It should be free of distracting or unnecessary interaction.
NOTE: In the next section I refer to unsynced items which means drinks recorded in the local storage but not on the server, I’ll discuss that whole business shortly, so please bear with me until then.

Drink capture screen on an iPhone
A simple interface
Two big buttons, one for each drink type and counters which increment with each click. These give instant feedback that drinks are being recorded and are enough information to remove anxiety, without distracting from the (next) primary action.
The counter has the total for each drink type, with the number of unsynced drinks in parenthesis. Once drinks are recorded on the remote server these transfer into the main count.
Periodically these counters are updated with data from the server to reflect any drinks recorded by other users.
Made responsive
By upgrading the form to post via ajax we prevented a page reload. Firing off an asynchronous request (handling response via a callback some time in the future) allows us to return control back to the user ready for the next submit which could be a mere fraction of a second later.
In fact we went a step further by using local storage to store the drinks. Recording the drink locally meant the posting of the drink data could happen completely independently making the form responsive whilst simultaneously achieving our goal to support offline transactions.
Offline data collection
To achieve this we used HTML5 local storage, extending form submission to record a drink in the local database instead of posting to the server. We note the type and time (so it can be posted to the server at leisure) of each drink purchased assigning a UUID and status flag — marking it in as unsynced.
Periodically posting all the drinks to the server, which responds with drinks it has saved, we mark those drinks as synced. The UUID helps to ensure that drinks aren’t accounted for more than once.
Removing unnecessary interaction
Firstly we ran the app as a fullscreen application on the iPhone by setting the following meta tag inside our <head> element.
<meta content='yes' name='apple-mobile-web-app-capable'></code>
Then we disabled the ability to zoom (by double tap or pinch)
<meta content='width=device-width; initial-scale=1.0; maximum-scale=1.0; user-scalable=no;' name='viewport'>
Combined with our super simple interface we hoped our users could tap away and the application would respond as we intended.
Testing in the wild.
Riding home on the tube one evening I sat and recorded a few hundred drinks underground. Once I surfaced the data started syncing as expected, but subsequent button presses started to lag and the app ground to a halt. We had written javascript that generated an ajax post for each unsynced drink, which was overwhelming the app — oh dear.
Modifying our approach to post a single payload; we deployed and all those pending drinks immediately synced and the app sprung back to life — Result.
Building the Infographic
Nicholas supplied us with a HTML/CSS template which became the basis for the infographic. The raw drink records were recorded in a database, exposed as the relevant statistics then placed into the template.
Scaling for devices
The template intended to run on a projector so was designed at a fixed size. A couple of days prior to the event we decided to share the application URL publicly on the day so resizing to fit regular browsers would be an ideal.
Sitting in the Belfast Malmaison pairing with Chris back in London, we re-wrote the HTML/CSS to make this a little simpler and added a few media queries to help compensate for the shift in display size.
Browser rounding inaccuracy.
The bar chart to display consumption over time was initially implemented with column widths set as a percentage of the entire page. These percentages turned out as fractions (width: 10.60%).

The large layout and browser tendency to round fractions caused cumulative inaccuracy, which manifested visually towards to the end of the bar-graph. Resizing the browser just made it worse — we had to fix it.
We re-wrote the markup to group everything into a hourly blocks (which were further divided into 15 minutes and 5 minutes sub-elements). This meant we could group and position everything within each hour, constraining errors to that (much smaller) boundary instead of over the total.
This also meant the whole bar graph scaled rather elegantly by comparison; we took the chance to combine the schedule information and time axis into each hour block so they scaled in line as well as being grouped semantically.
On which note ..
Steffan Williams recently wrote an article which highlights some of these rounding inconsistencies; however I think with a little thinking they can be overcome sufficiently.
Working offline
-
Rack-offline intentionally doesn’t work in development environment.
Whilst it makes sense to only work in production (so you don’t have to deal with cache when writing code) we were caught out by this a few times.
-
There isn’t a clear way to remove offline-cached application content.
This makes testing a little cumbersome especially when you have to restart your Rails application with each change running in production (see previous point).
-
Serving offline pages without .html works fine on iOS devices.
At first, we thought we’d have to create a static page in order to get mobile safari to work offline, and most google results suggest explicitly using .html when calling the page.
We found simply using standard Rails routes (without the .html) the iOS devices would still honour the offline content.
Securing the application
Because we wanted a ‘desktop’ iPhone app (i.e. fullscreen mode) we ran into a few problems in regards to security:
- HTTP Basic authentication prompted for username/password on every request.
- Putting username & password in the URL prevented offline support.
- Cookies aren’t shared across browser and fullscreen applications.
- Redirects aren’t followed in fullscreen so we couldn’t use a form to auto login.
Our solution was to use security through obscurity, having a special URL that we could load and save onto the users iOS home-screen. This URL would pass a secret token to the Rails controller which would authenticate transparently to the user.
Visiting this URL would place a token into the page markup which Ajax requests would use to authenticate without needing user interaction.
We ran the application over SSL to prevent snooping of the secret URL.
On the day
Arriving at the Waterfront to setup on the day, we got the application displaying on two 52-inch flat screens with a further feed running to the main stage projector to display during the breaks.
The volunteers’ were setup with the application on their iPhones and iPods and they quickly dispersed to track the first drinks of the day.
Live changes
Viewing the application on the flat screens I realised the contrast between the type and background colour was a little low. Tweaking the CSS, I deployed the change with the knowledge that all the drinks would be recorded locally. Once deployed the screens refreshed with the information looking much sharper.
Just before lunch, using the data collected so far I calculated the average rate at which attendees we’re consuming coffee so I could adjust the bar-graph inline with the distribution of data. This enabled me to make the spikes in caffeine consumption appear more dramatically on the infographic.
Just as planned
It was great to see everything working so well. The hard work to ensure stability paid dividends, and the reaction the application received from attendees and online was universally positive.
The application is frozen to reflect the conference day so you can check it out.
Thank you
Our thanks go out to Campaign Monitor for making the application possible, Nicholas Felton for the design, Andy McMillan for conceiving and organising the whole project, as well as getting us on board. Thanks to all the volunteers on the day. Caffeine Monitor was great fun to make, to see it come alive on the day.
Special thanks to all the caffeine addicts at Build Conference whom without their endless need for a pick-me-up the project would have been a disaster.
Cheers!
Suggested reading
- Campaign Monitor cover Caffeine monitor on their blog.
- Web Standardistas give their account as attendees of Build.
If you have any feedback on this article, please get in touch!
Historical comments can be found here.