Thursday 12th October, 2017
 by Chris Lowis
Show and Tell 37
James, Chris and I were joined by Ben G, Chris P, Tom S, Chris Z and Graham P for our 37th Show & Tell event last night.
We host these events to provide a welcoming, supportive environment for people to share their side-projects, ideas and thoughts. I’m always impressed by the variety of things we see and this week was no exception.
Thanks go to Tom for the photos and to everyone for sharing the various things they’ve been working on.
Planes and boats
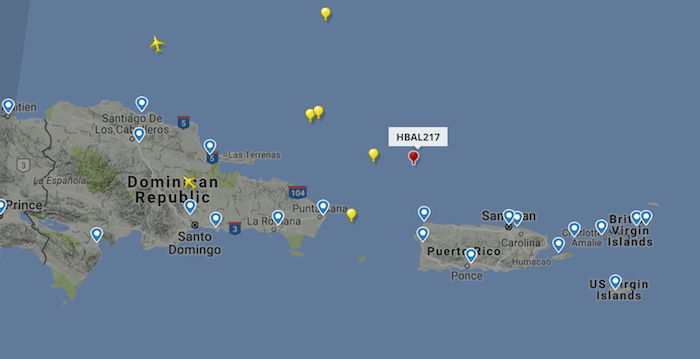
Chris started with a quick demo of Flight Radar 24 a website he’d found that lets you track the real-time position of aircraft around the world. In particular Chris was struck by the Project Loon balloons at 60,000 feet above Puerto Rico providing communication services in the wake of Hurricane Maria.
Chris and his partner Amy live on a 100 year old former Dutch tulip barge on the Thames. They’ve been making some fairly extensive changes to the boat including a recent extension to provide them more living space. With the major metal work completed Chris has been working on the inside of the boat including fitting some insulation between the hull and the cabin walls. Chris showed us some photos of the work so far and some curiosities he’d discovered - including some incredibly dense lead ballast material, and a faded number painted on the steel that may provide some clues as to the history of the boat.
Chris also drew some parallels between this work and his day job, software development. In particular Chris noted that given the irregular, curved surfaces of the boat, it wasn’t until he’d made a start on the battons and insulation that he was really able to visualise how things would go together. Chris likened this to a spike - a way of mitigating future risk in software projects.
Insights from your test suite
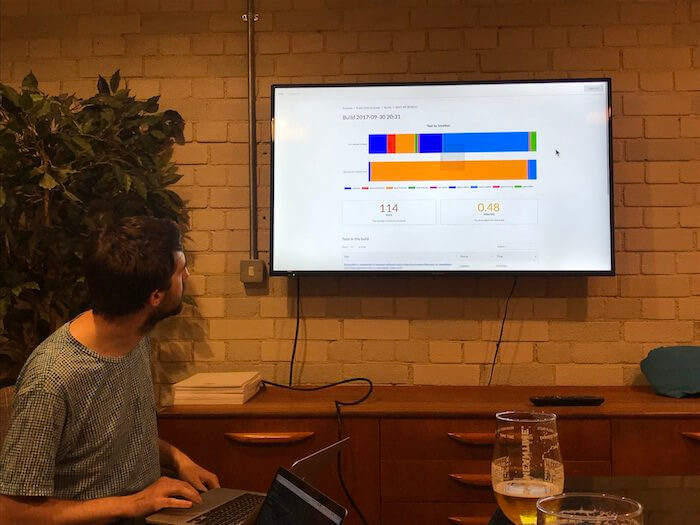
Newcomer to Show and Tell Chris Zetter showed us a side-project he’s been working on which aims to extract insights from the historical runs of a projects test suite. Continuous Integration systems such as Jenkins allow you to see how long each build has taken but Chris was interested in more granular data - which individual tests have become slower, how many new tests have been added and which are the most likely to fail, for example.
Users of the system install add a Ruby gem to the project’s Gemfile (Chris has this working with RSpec and Minitest so far) which sends data about the test suite to a central server. A web application then tabulates and graphs this data to allow you to understand it.
Chris talked a bit about what he plans to do next - including trialling the service with some real-world applications. We also had a discussion about one of Chris’s key challenges - turning the data he is collecting into actionable insights. He mentioned that seeing those tests that occasionally fail has already been useful - it’s a strong indicator of an intermittent test that could be improve or replaced. The working title of the project is URF - short for Useful, Fast, Reliable. Chris said he feels the data he already collects helps to identify slow and unreliable tests - but there’s a lot of scope for collecting information that tells the user whether an individual test is useful.
There was a lot of support for Chris’s project in the room - with several of us saying that we’d find such a service useful for the applications we work on. It’ll be fascinating to see where Chris takes this next.
Things found on old laptops
Before Ben sold an old laptop he thought he’d better have a look on the disk to see if there was anything valuable. He found a few old projects that he’d worked on while CTO at MakieLab.
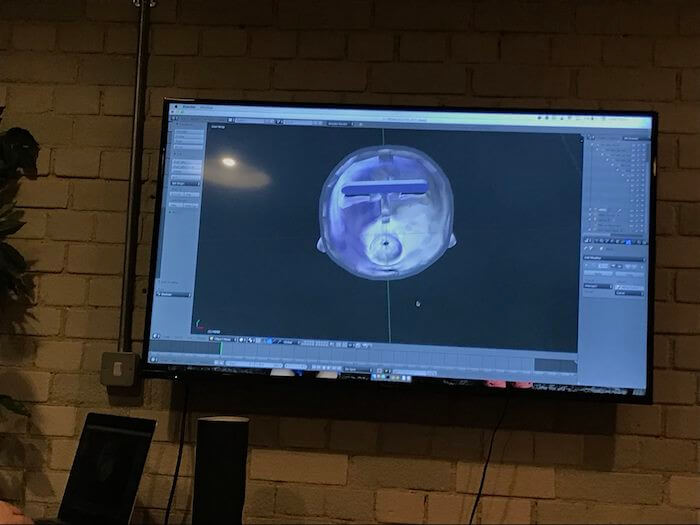
These projects were part of the system which allowed users of the website to design, and then have 3D-printed, their own customised doll.

The doll’s face was a composite of more than 30 different models which each varied one parameter such as the size of the nose, the length of the ears, or the spacing between the eyes. By moving sliders on the web site users could blend between these different models to vary the face.
At the time Ben built the system, the support for Adobe Flash was starting to wane. Ben used WebGL to render the model in supported browsers and also developed a pure-JavaScript rendering engine as a fallback. Ben had unearthed one of the first versions of the code where he had succeeded in rendering a single eye ball.
Ben then talked us through the pipeline that would take the user’s parameters and apply them to the manufacturing model that generated the file sent to the 3D printer. Ben used Blender to show us one of these models including the parts not visible to users of the web interface - such as the fixings on the inside of the dolls head that would join it to the neck.
We had a brief discussion about the work we put into code for the companies that employee us and how we feel when the companies are shuttered and these projects are no longer available.
Plain-text accounting
I’ve started keeping track of my personal accounts using a plain text accounting system. In this system I record entries using a double-entry format in a plain text file, called a “ledger”. A simple entry looks like
2017/09/03 National Rail
    Expenses:Travel:Rail                       £20.20
    Assets:CurrentAccount
which says that on the 3rd September I purchased a train ticket for £20.20 from my Current Account. The current account is debited by -£20.20 and the Expenses:Travel:Rail account is credited by £20.20. Using the command line tool hledger I can generated summaries of my monthly spending from the command line. For example, using some dummy data I created for the demo last night:
$ hledger -f ledger.dat balance -M --tree
Balance changes in 2017/09/01-2017/10/31:

                  ||  2017/09  2017/10
==================++===================
 Assets           ||  £377.40  £410.00
   CurrentAccount ||  £377.40  £410.00
 Expenses         ||  £122.60   £90.00
   Books          ||        0   £10.00
   Cash           ||   £92.00   £42.00
   Gifts          ||        0   £30.00
   Personal       ||    £8.00    £8.00
     Haircut      ||    £8.00    £8.00
   Travel         ||   £22.60        0
     Rail         ||   £20.20        0
     TFL          ||    £2.40        0
 Income           || £-500.00 £-500.00
   Salary         || £-500.00 £-500.00
------------------++-------------------
                  ||        0        0
Because the ledger is maintained in a simple text file it is easy to keep it in version control and use the tools I am familiar with - greping the file for entries, for example, or examining the diff between two dates.
My bank makes my statement available as a CSV file so I’ve written a short script to convert this to ledger format and I use the banks2ledger tool to guess the categorisation of new entries based on my previous data.
I’ve found the act of going through my spending once a month quite useful in itself - it gives me the opportunity to spot any changes in my spending habits, or notice when regular payments change.
Show & Tell 38
We’ll be hosting our 38th Show & Tell on Wednesday 8th November. It’s open to all so please get in touch if you’d like to join us.
If you have any feedback on this article, please get in touch!
Historical comments can be found here.