Friday 8th June, 2018
 by James Mead
Show and Tell 44
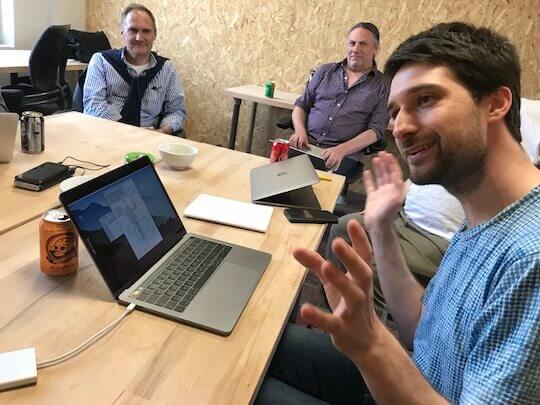
We decided to try holding this month’s event at our office in the Ministry of Startups in Whitechapel. We wondered whether holding the event a bit further away from the centre of London would discourage attendance, but seven people turned up, so perhaps we’ll do it again. We made do with a large monitor rather than the giant screen that we had access to at Forge & Co. This seemed to work OK, but it would be nice to have a bigger screen or a projector.
Migrating web apps to Dokku
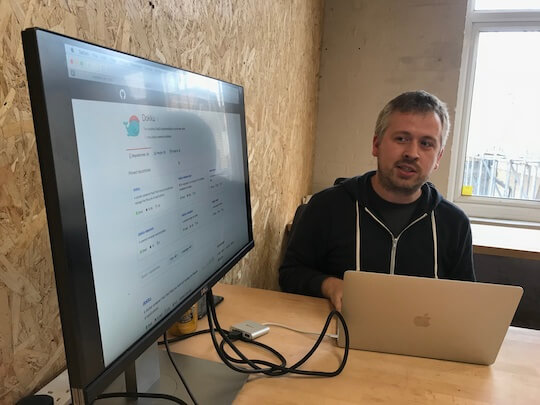
James A runs a bunch of web apps on his Linode VPS. They’re a pain to maintain, because each of them needs a different version of Ruby and several of them depend on specific packages like fonts & PhantomJS. Some time ago he hacked together a Docker pipeline which worked in a similar way to Tom W’s recap. This built a Docker image locally, pushed it to a registry, and then pulled it down onto the VPS. This all worked OK, but was a bit of a pain and obviously relied on custom software to pull it all together.
Recently he decided to try moving all the apps to an installation of the open-source Heroku-a-like Dokku on his VPS. He was pleasantly surprised how easy it was to do and particularly pleased that he was able to do it with zero downtime. He demonstrated how easy it is to use by creating a new Rails app and deploying it by pushing it to a git remote, just as you would for an app on Heroku. He explained that it uses Heroku buildpacks and deploys the app to a herokuish container.
Dokku provides zero-downtime deployments by default by managing an instance of Nginx outside Docker which is used to proxy request to the relevant container. When an app is deployed a new container is started alongside the existing one and once the new one is deemed healthy Dokku starts proxying new requests to the new container. James was able to run the Dokku-managed Nginx instance alongside the existing instance Apache on a different port and then swap over seamlessly once the relevant app was migrated.
Train timetable visualisation
Chris Z commutes by train between Hitchen and London. The recent completion of the Canal Tunnels meant that trains could run from Finsbury Park to St Pancras for the first time. This resulted in a major change in the timetables from 20 May with his trains now routed through London via St Pancras rather than terminating at Kings Cross.
The train companies didn’t do a very good job of communicating the timetable changes (e.g. a giant A3 PDF) and Chris was keen to see whether he could find a helpful way to visualise the changes. Initially he looked at fetching the data from the official Darwin Data Feeds, but these are hard-to-use SOAP/XML feeds with strange acronyms. He then discovered he was able to obtain the relevant data from transportapi’s more friendly JSON API under one of their free plans. He then used this data to generate Marey-style diagrams with some custom code in conjunction with the D3.js charting library.
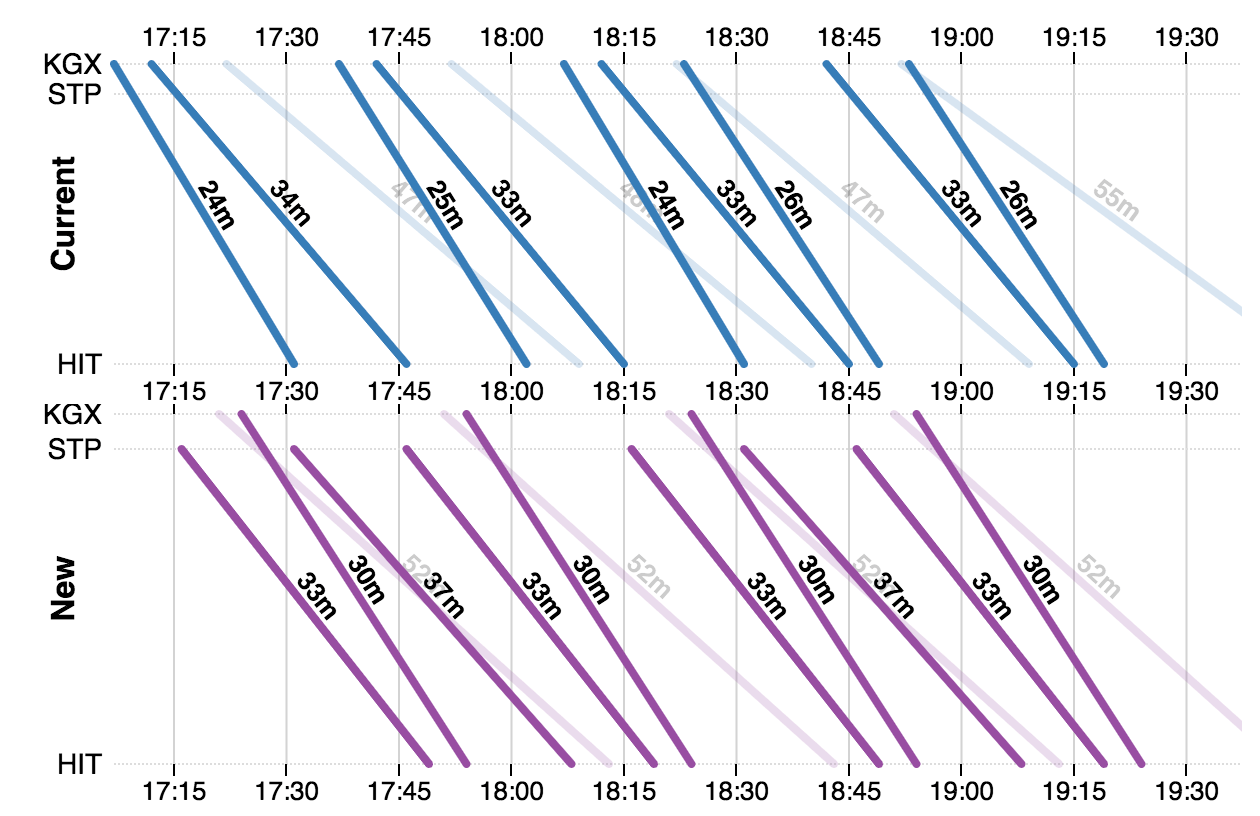
Chris has built a general purpose tool which you can use to visualise the direct journeys between any two stations on the UK rail network. He’s also written the whole thing up in more detail on his blog.
Programmatically generated maps
In last month’s Show & Tell, we demonstrated the beginnings of a game for Amazon’s Alexa, in which the player starts in an unknown position on a map and has to navigate a ship to port by listening to the sounds around them as if they were lost in fog. This time Ben demonstrated how he had programmatically generated a realistic looking map from a simple ASCII grid.
Ben was inspired by Martin O’Leary’s maps which are published via @unchartedatlas. The first stage of Ben’s approach was to plot a load of random points and to divide the plane into a polygon per point by finding all the points which are closer to the random point than any other. This division into polygons is called a Voronoi diagram and Ben used the rubyvor library to implement this.
The next stage is to annotate various points on each polygon based on data from the underlying ASCII grid used by the game mechanics. For example, calculating a height based on distance from the coast plus/minus some randomness. The idea being to generate a physical representation of a somewhat realistic landscape. The final stage is to colour in the map based on this physical representation and doing some blending and blurring.
I’m sorry the above isn’t a very fulsome explanation, but if you’re interested in knowing more, the code is publicly accessible on GitHub. I think the end result looks great and I hope we manage to find the time to do some more work on this game.
Celestial navigation

I had brought along the cheap plastic sextant that I own and showed people how to use it, although it wasn’t ideal because we couldn’t see either the sun or the horizon! I described a couple of the simpler ways you can determine both your latitude and longitude your using just a sextant, a nautical almanac and an accurate watch.
For example, taking a noon sight where, if you know the approximate time of local noon, you measure the altitude of the lower limb of the sun 15-30 minutes before local noon making a note of the exact time, then leave this altitude set on the sextant, and wait for the lower limb of the sun to drop back down to the same altitude after local noon, recording the exact time at which this happens. You can then average the two times to obtain a very accurate time for local noon which is easily converted into a longitude for your position at local noon.

Unfortunately I got in a bit of a muddle about how some of the maths worked, but hopefully people got the idea. I finished up by explaining how it’s possible to apply corrections to make the measurements as accurate as possible, e.g. correcting for error in the sextant itself (index error), adjusting for the height of your eye above the horizon, and correcting for refraction of light in the atmosphere, particularly important when celestial objects are low in the sky.
Show & Tell 45
We’ll be hosting our 45th Show & Tell in June. Please get in touch if you’d like to join us.
If you have any feedback on this article, please get in touch!
Historical comments can be found here.